In 2009 and 2014, the City of San Marcos hired a survey research firm, True North Research, to perform a city-wide Community Opinion Survey. The City’s rationale behind paying ~$20,000 for each survey can probably best be described by City Manager, Jack Griffin:
“Learning how our community feels helps the City Council and City staff make sound, strategic decisions in a variety of areas including service improvements and enhancements, measuring and tracking internal performance, budgeting and planning.”
Perhaps the most important survey question was the question about improving quality of life. Residents of San Marcos were asked in both the 2009 and 2014 survey: What change could the San Marcos government make that would most improve the quality of life in the city? The question was open-ended (respondents were not prompted with a list of options) and respondents were only allowed to respond with one change the City government should make to improve the quality of life. For each survey, all answers were grouped into categories based on the main topic of the response.
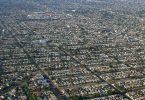
In 2009, (San Marcos population estimate = 78,000), these were the top 5 categories in which the people of San Marcos responded as to how the City could improve the quality of life:
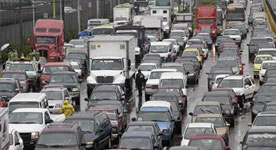
- Reducing traffic congestion, 11%
- Limiting growth and development, 9%
- Improving infrastructure such as streets and roads, 7%
- Improving local schools/education, 6%
- Improving public safety, 6%
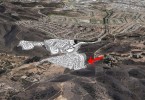
In 2014, (San Marcos population estimate = 88,000) these were the top 5 categories:
- Reducing traffic congestion, 21%
Note: “Improve traffic lights, signals” was the #9 most popular category, 5% of all responses. This was not a category in 2009, so one could argue that the improving traffic lights response should fall into the Reducing traffic category, therefore “Reducing traffic congestion” actually accounts for 26% of the responses. - Improving local schools/education, 9%
- Limiting growth and development, 8%
- Improving or adding sidewalks and bike paths, 7%
- Improving infrastructure such as streets and roads, 7%
As of the 2017 census, the population of San Marcos is estimated at roughly 96,000.
For the full survey results, see San-Marcos-Satisfaction-Survey-2009 and San-Marcos-Satisfaction-Survey-2014.